Web UI
Run flow web from any host that can reach your RunLog backend.
The CLI launches a FastAPI server on 127.0.0.1:8080 by default
(localhost-only — SSH-tunnel or front with a reverse proxy for
remote access; binding to a non-loopback address logs a loud
warning since the alpha ships without bearer-token auth).
pip install "ematix-flow[web]"
flow web --port 8080
# open http://127.0.0.1:8080/
The SPA matches this site’s Pip-Boy / Carolina-teal theme. Two top-level views (Pipelines and Jobs) plus a per-run detail page.
Pipelines — last 10 executions at a glance
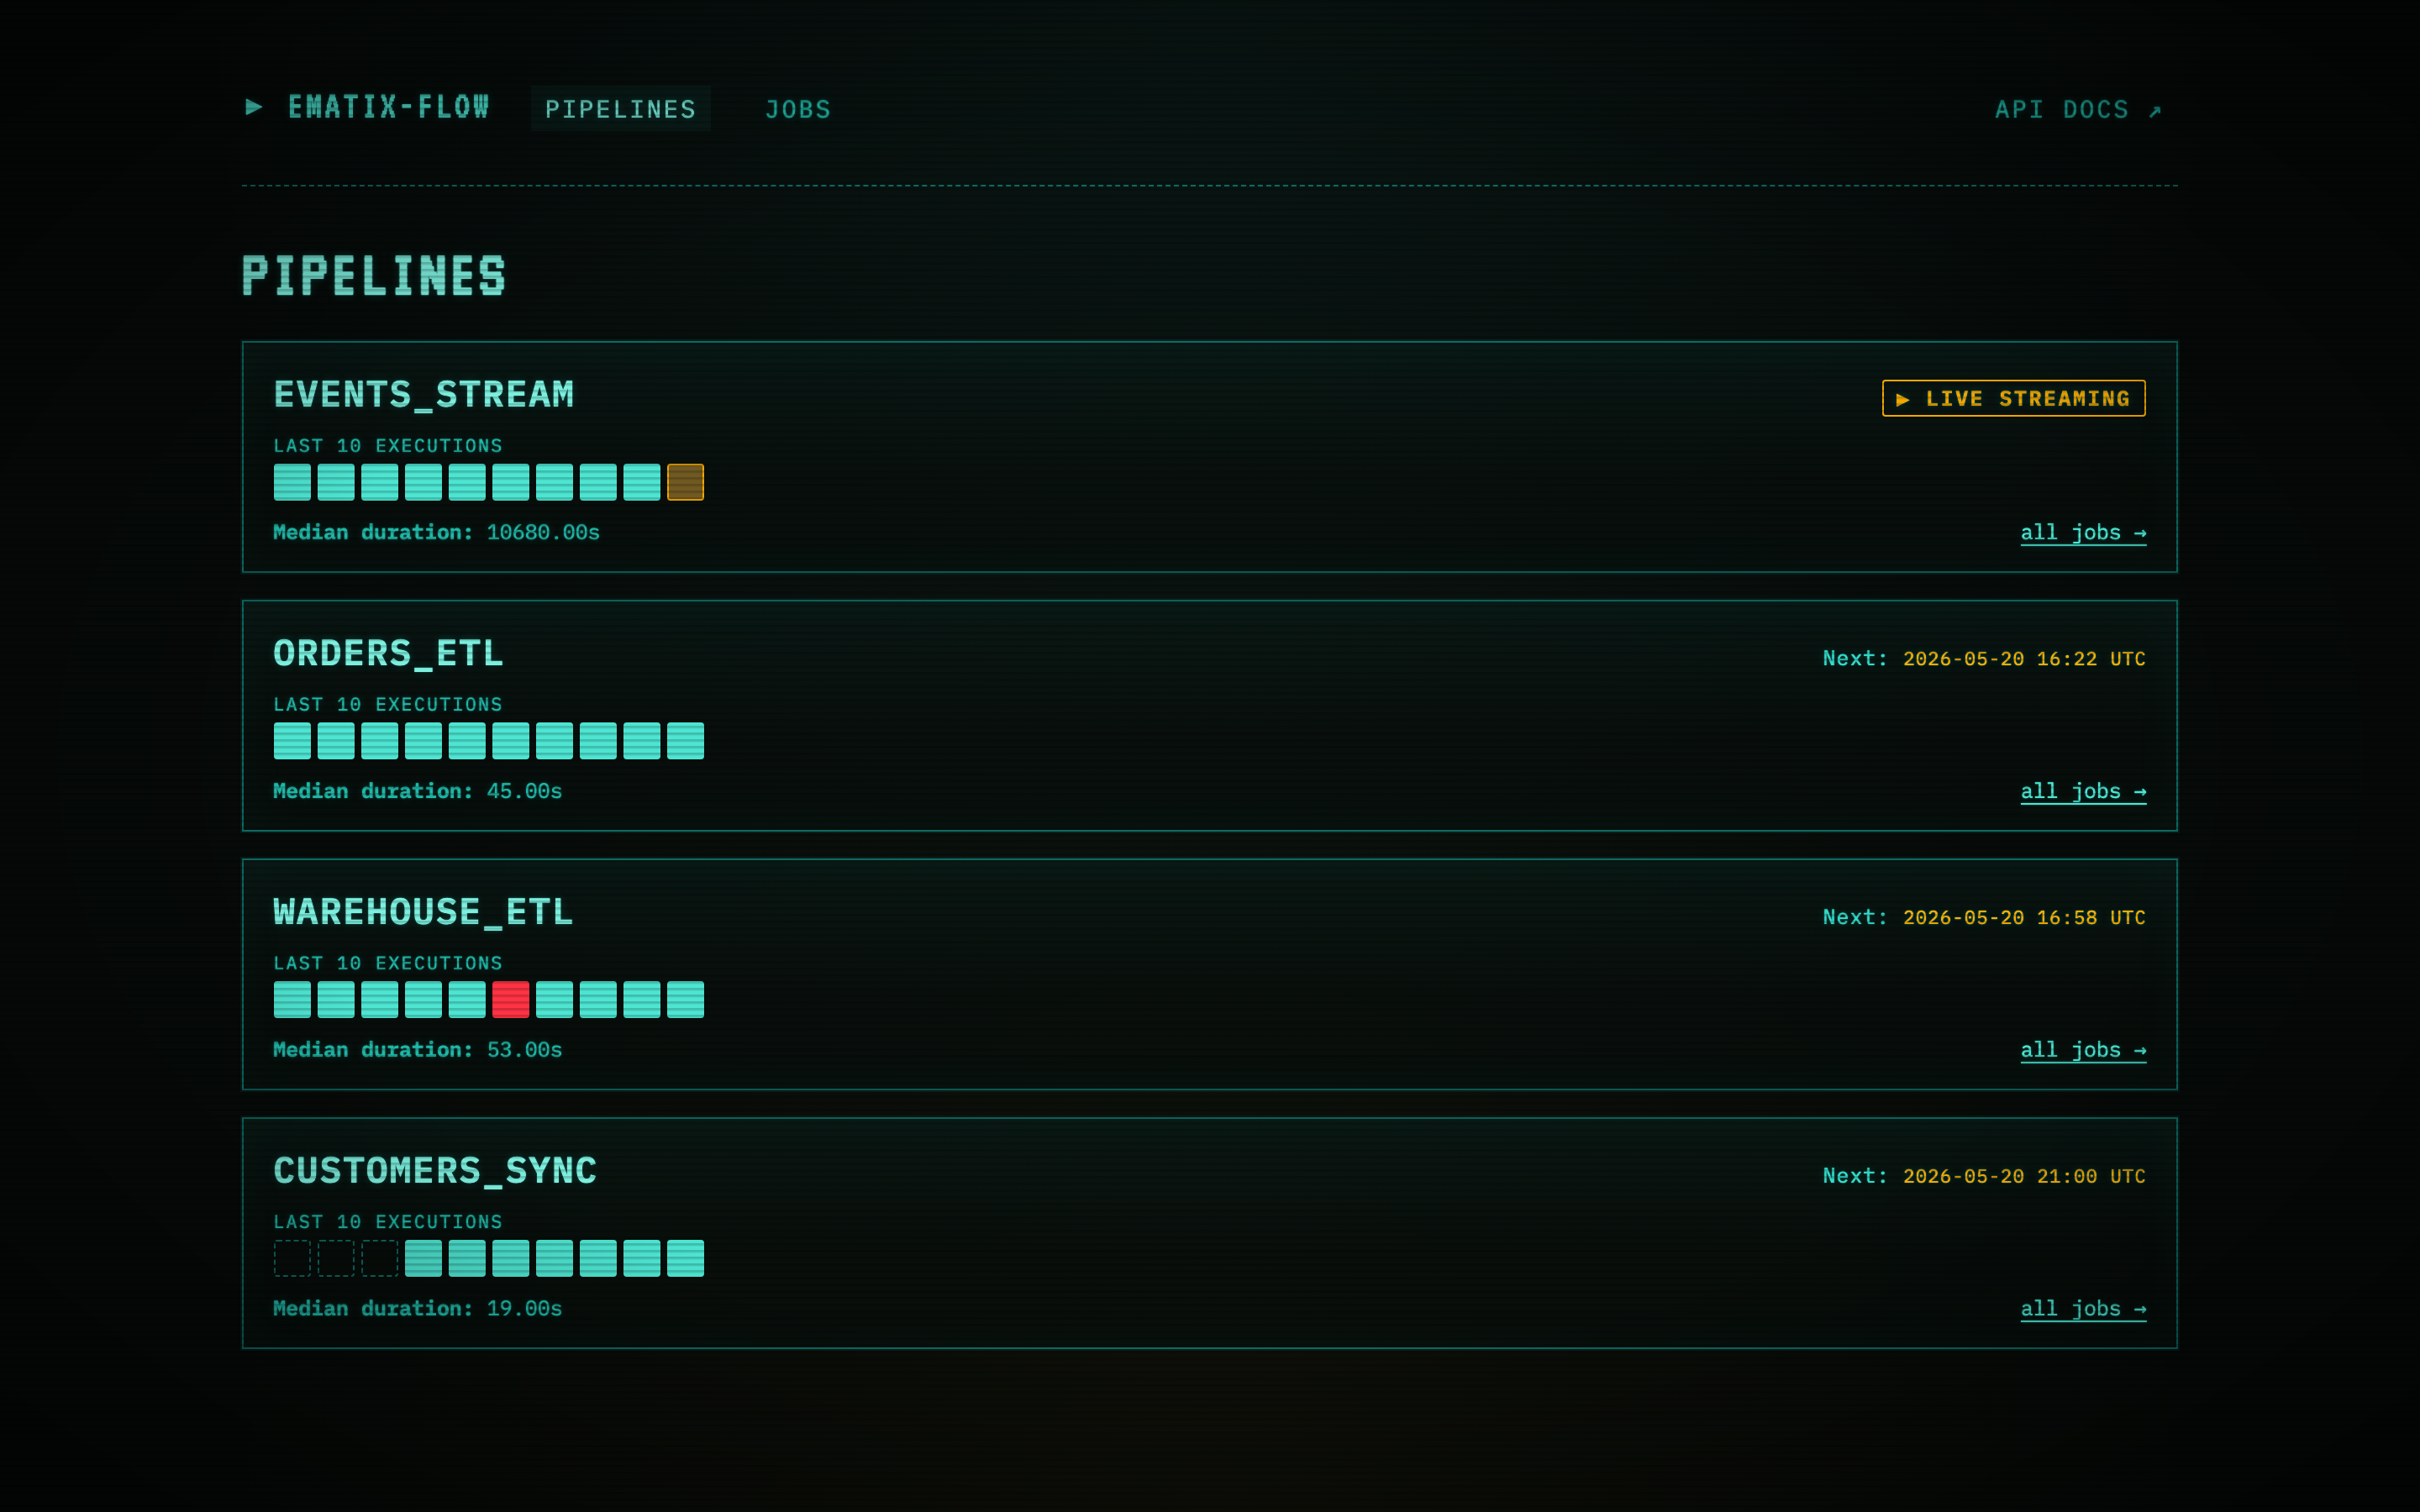
The landing page is per-pipeline, not per-run. Each card shows:
- Name + kind of the pipeline.
- Last-10 execution strip — one colored square per execution, oldest left → newest right. Teal = succeeded, red = failed, amber-pulse = running, dashed = no run yet. A run that retried and eventually succeeded counts as a succeeded square (the final attempt’s status is what matters here — drill into the job to see the per-attempt history).
- Next:
<UTC timestamp>for batch pipelines on a cron, or LIVE STREAMING for streaming pipelines (events_stream in the screenshot pulses amber). - Median duration and a link into the full Jobs table filtered to that pipeline.
Clicking any square drills into the run detail page for that execution, including the task-DAG visual.
Jobs — every run record in a flat table
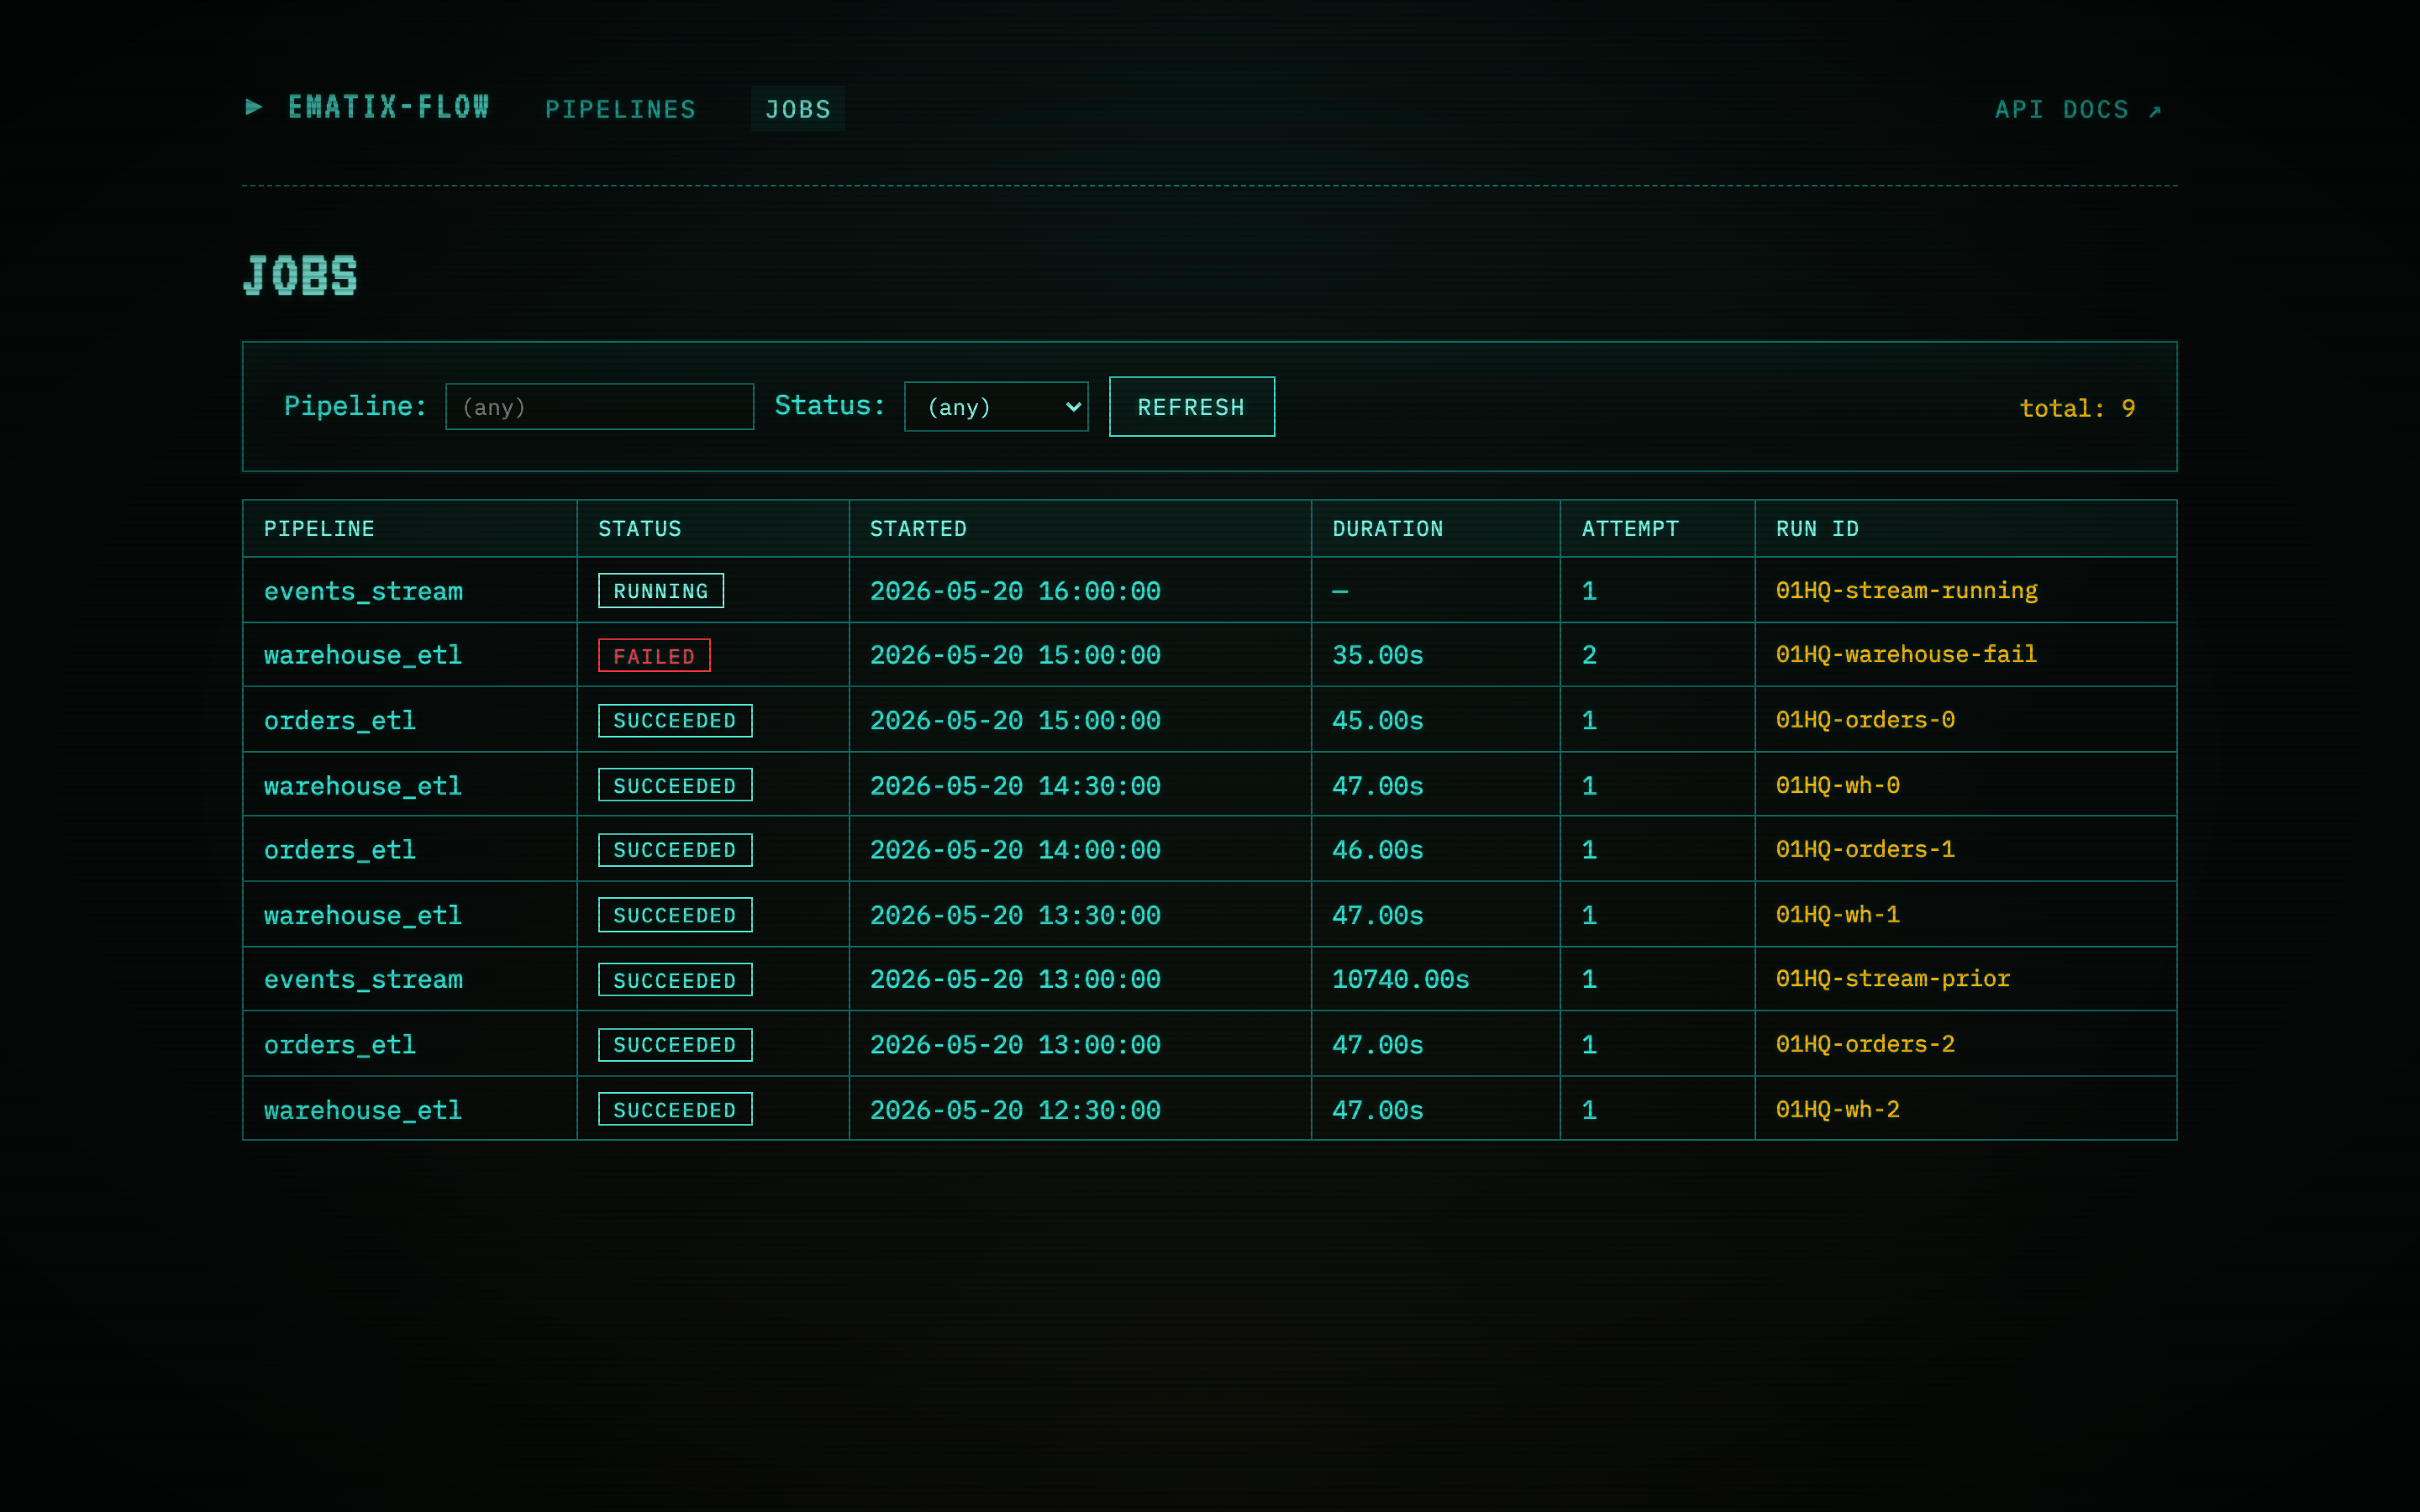
When you need to filter, sort, or scan recent failures across every pipeline at once, the Jobs view is a flat table of every run record. Status pill, pipeline name, started/finished timestamps, attempt count, duration, and the failed step (if any) all sit in the row. Clicking a row opens that run’s detail page.
Workflow DAG — live task graph with parallel branch
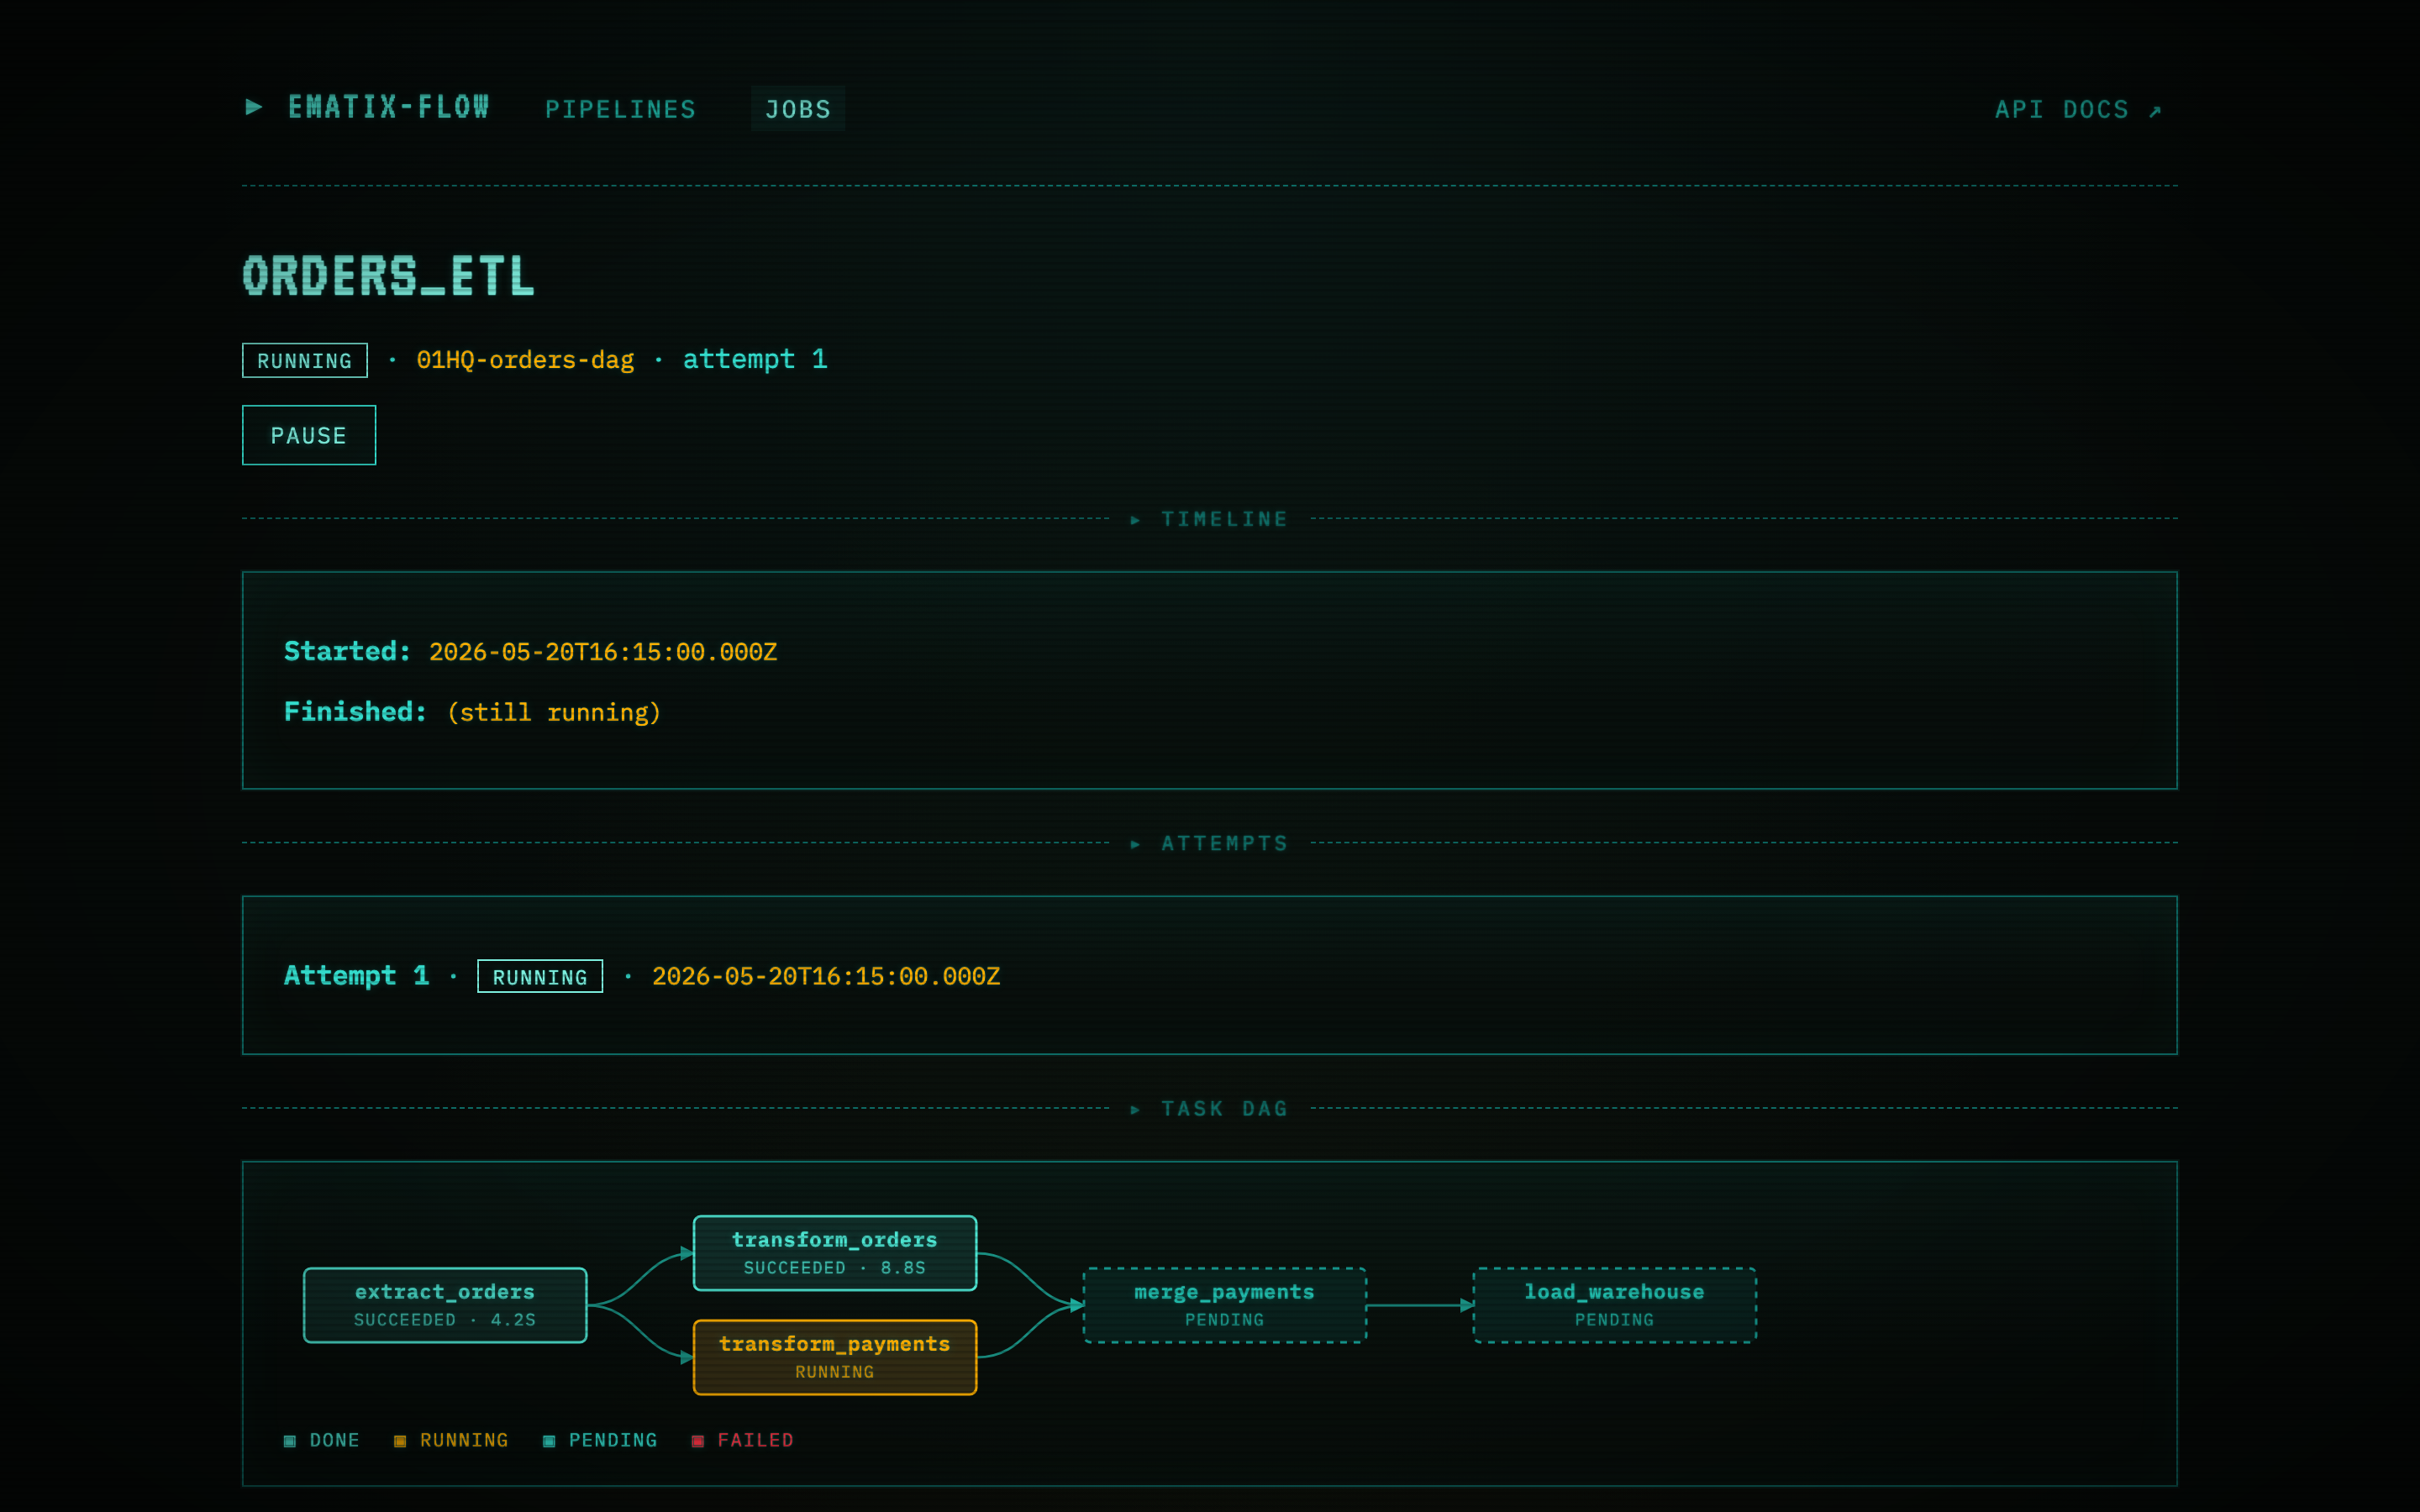
A workflow in flight. The DAG is rendered as an SVG inside the run detail page (no external charting dep — same Pip-Boy theme as the rest of the UI). Reading left-to-right:
extract_ordersfinished first (4.2 s).- It fans out into two parallel branches —
transform_orders(completed, 8.75 s) andtransform_payments(currently running, pulsing amber). merge_paymentsjoins them back together. It’s dashed + dim because both upstream dependencies haven’t completed yet.load_warehouseis the terminal step; still pending.
The dashed border + dim color means a step is pending (waiting
for its depends_on). Solid amber pulse = running. Solid teal
= succeeded. Solid red would be failed. The legend under the
SVG calls all four out.
The layout is longest-path-rank: every node sits to the right of every dependency. Sibling steps at the same rank stack vertically — that’s where parallelism is visible at a glance.
Failed run — Restart from failed step highlighted
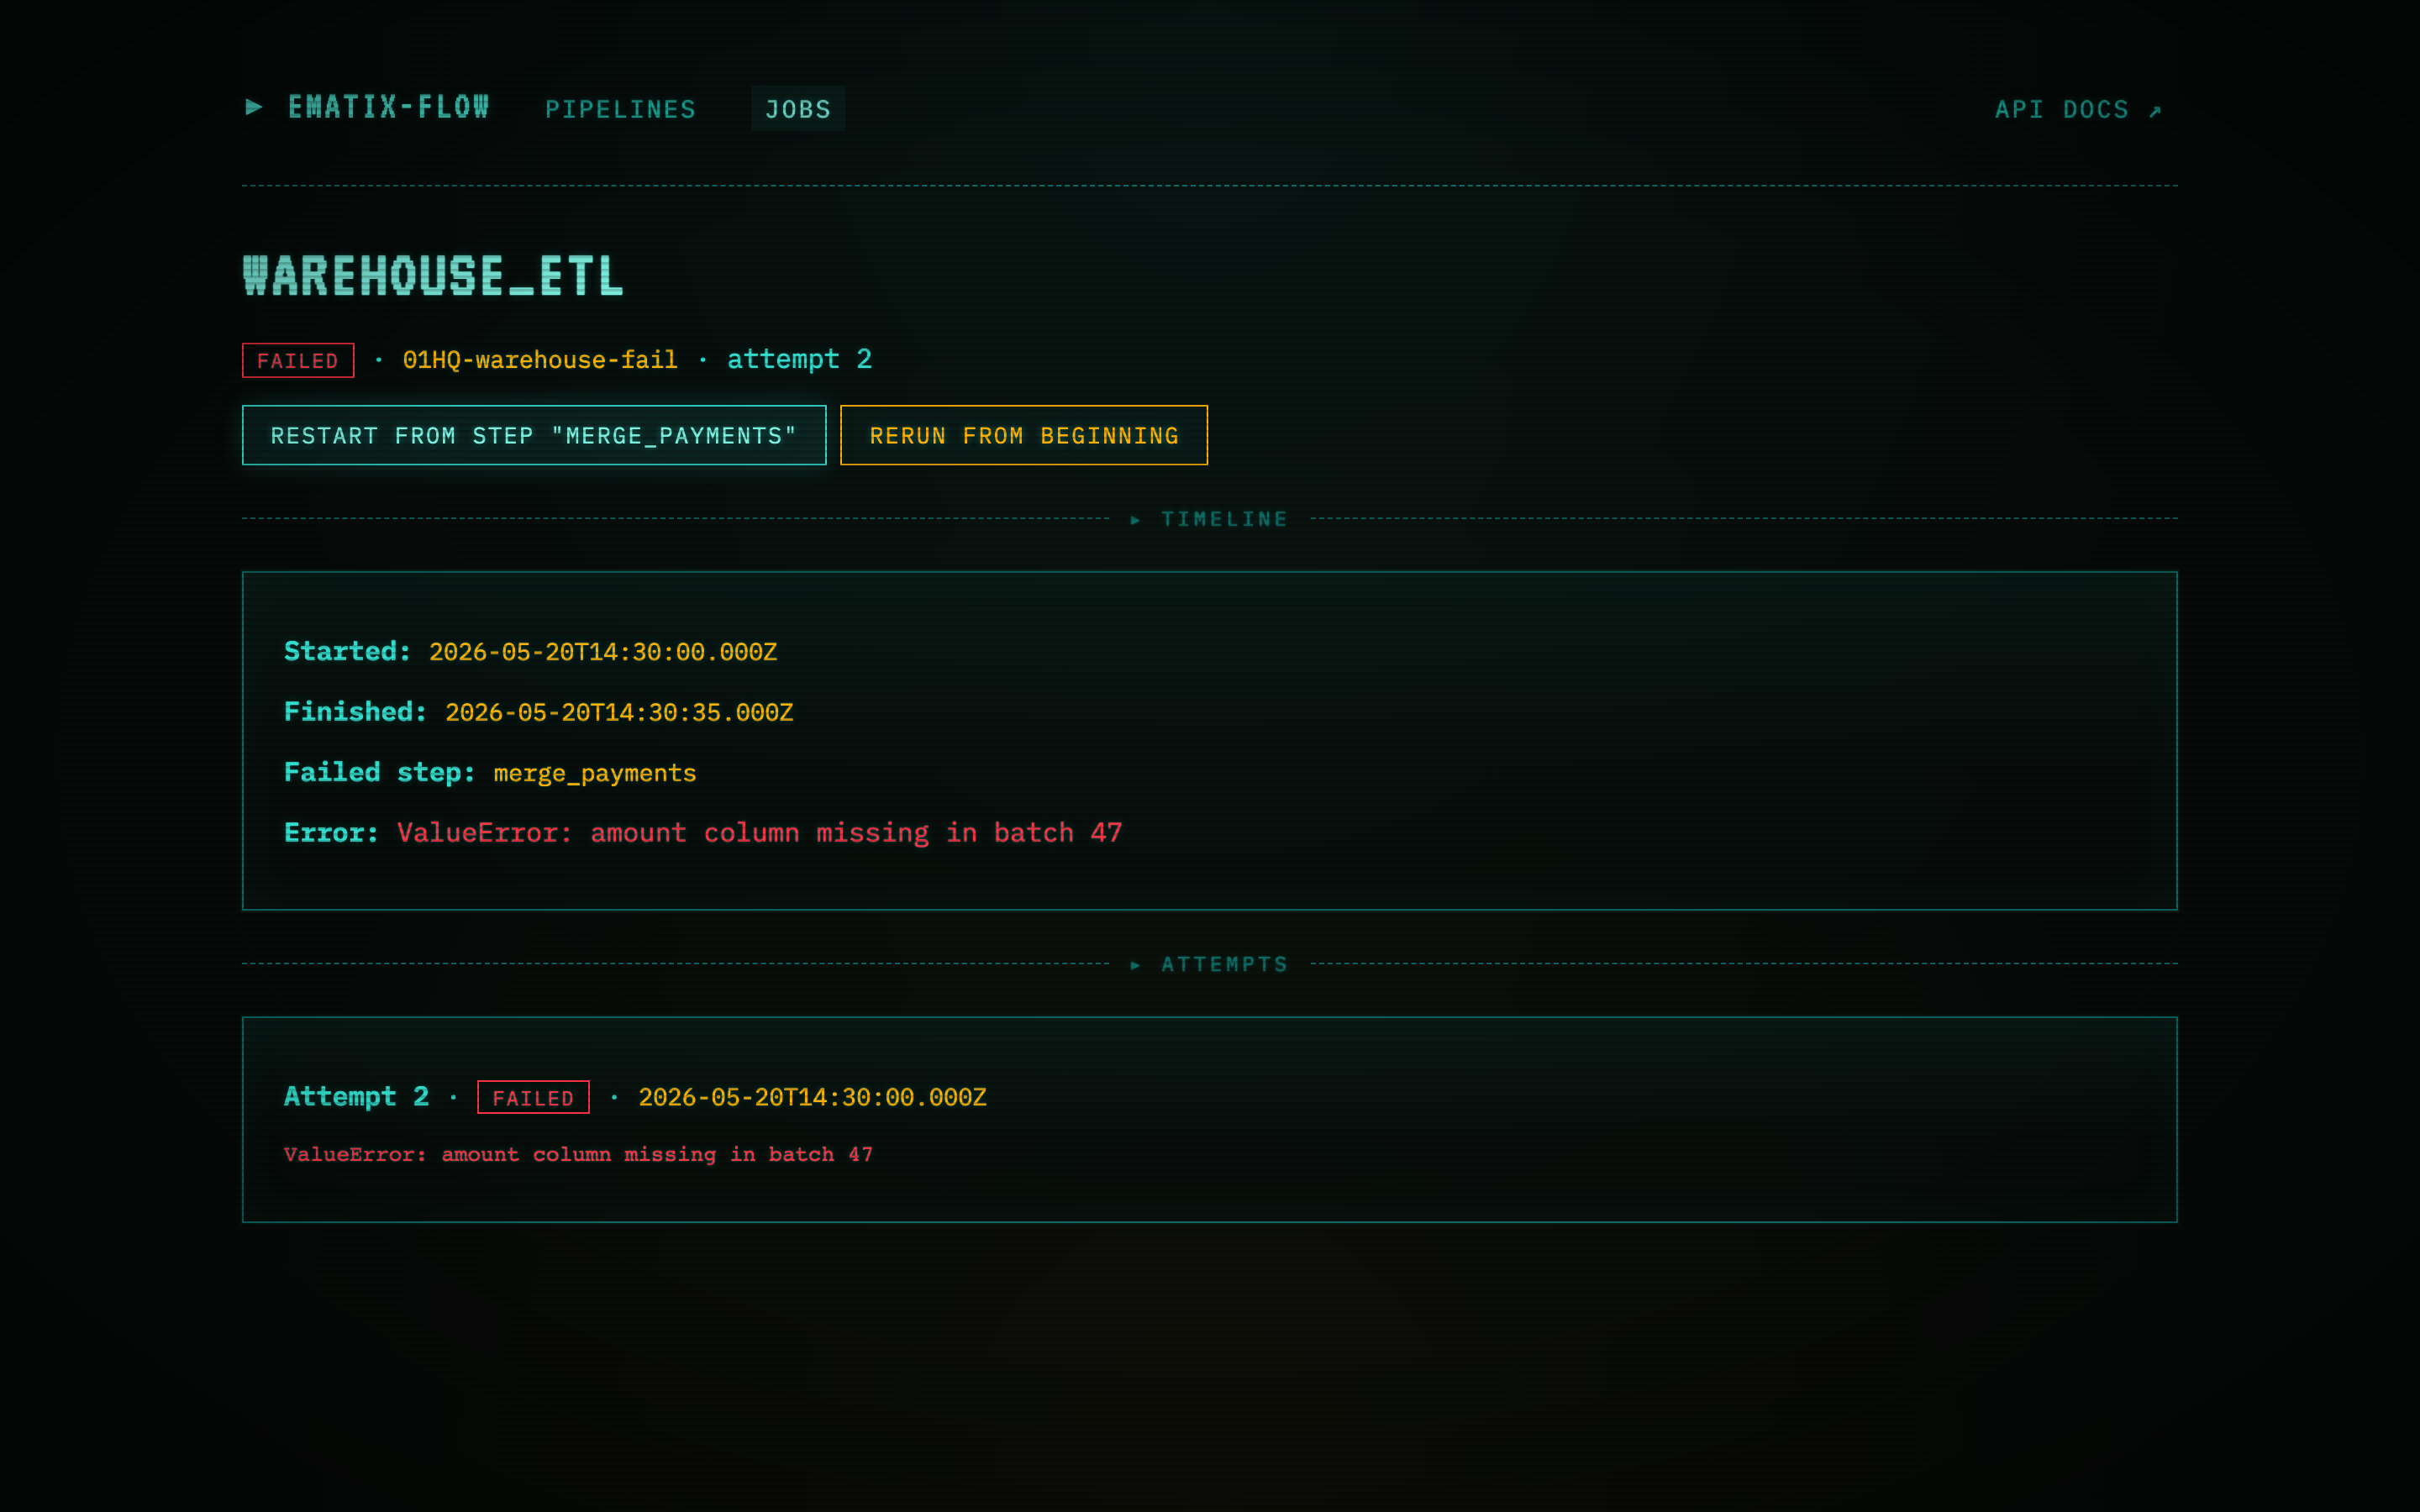
A workflow that hit an error mid-DAG. The detail page exposes
the exact step that failed (merge_payments), the error
(ValueError: amount column missing in batch 47), and the full
retry history (two attempts, both failing on the same step).
The RESTART FROM STEP “merge_payments” button is one of two
restart actions surfaced on a failed batch run. Clicking it
POSTs to /api/runs/01HQ-warehouse-fail/restart with
{ "from_step": "merge_payments" }. The scheduler picks up
the new “requested” row on its next tick (default 10s) and the
worker resumes the DAG from merge_payments — load_orders’s
output is reused, so the re-run is the failed step plus
everything downstream, not the whole pipeline.
The RERUN FROM BEGINNING button next to it kicks off a fresh run from scratch — useful when the source data has changed or the failure was non-deterministic.
For streaming runs, the same button reads RESUME FROM WATERMARK instead and resumes from the last committed watermark rather than a discrete step. Rerun from beginning is available on any terminated run.